What is a time-location diagram?
Last updated 8 October 2026
A chart of where and when work happens along a route. Distance runs one way, time the other. Each activity is a line or a block. The standard view for roads, railways, pipelines and power lines.
Also called: time-distance, time-chainage, linear schedule, line of balance, march chart, French diagram.
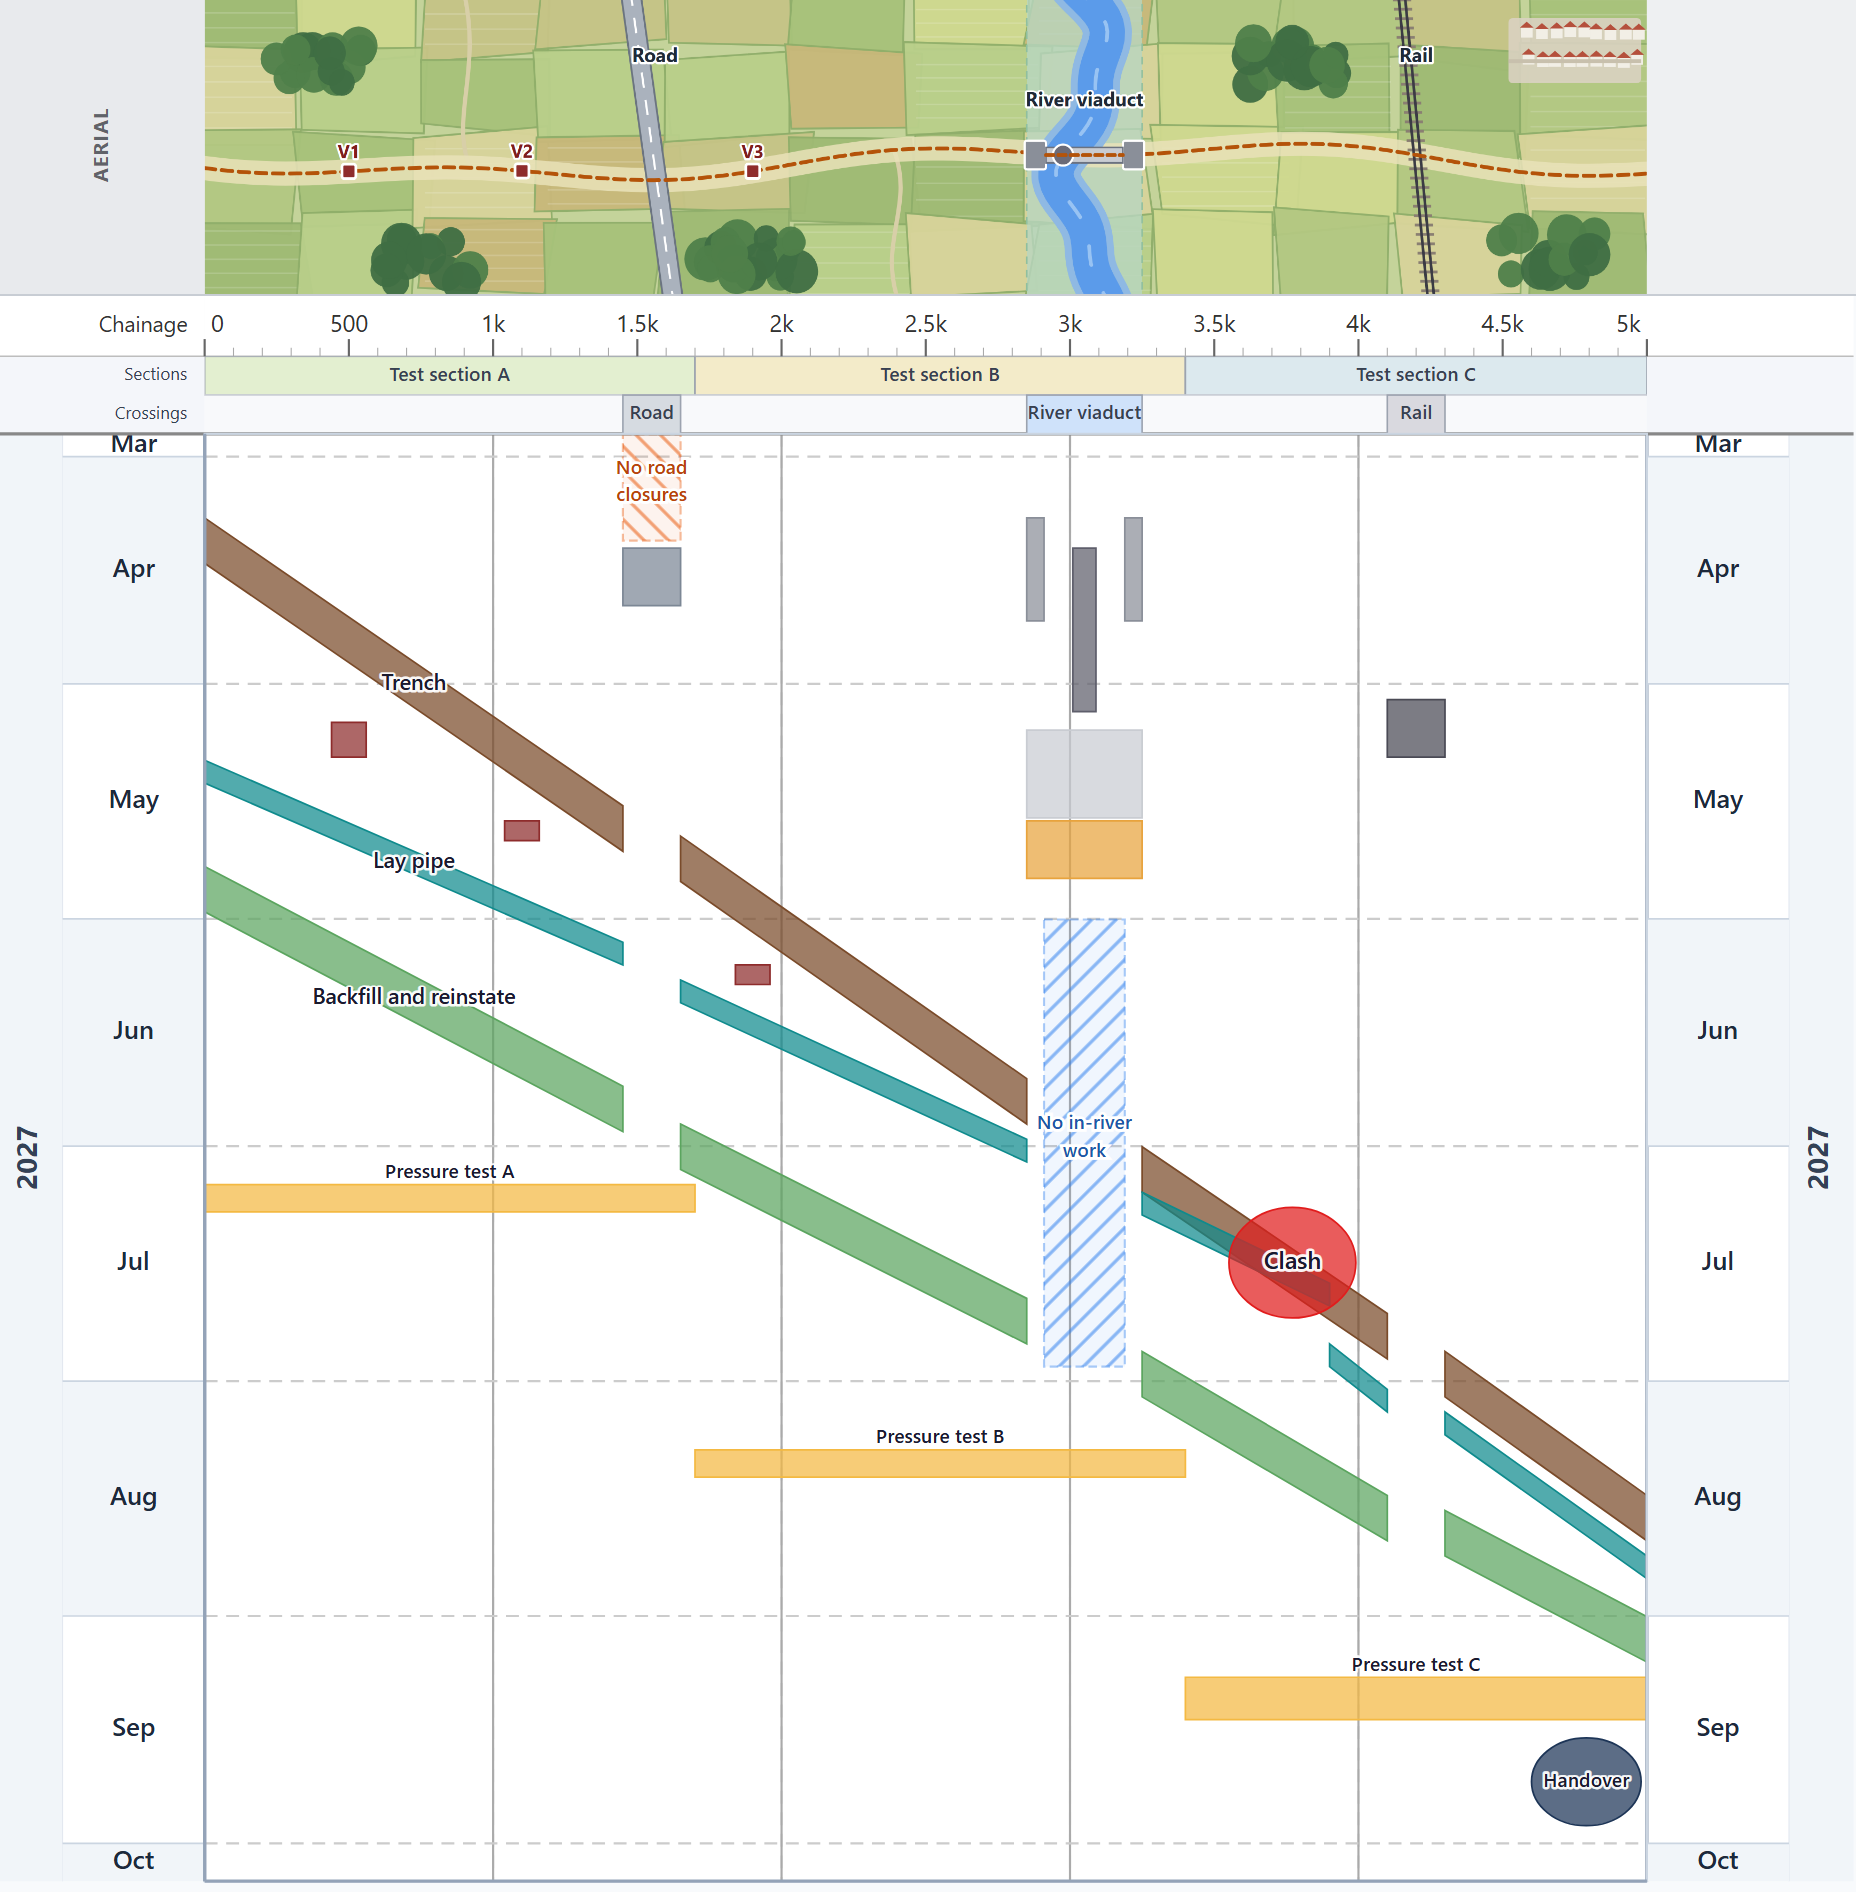
How to read it
- Across: distance. The map on top is the route. Under it, chainage runs 0 to 5 km, with the test sections and crossings named.
- Down: time. April to September 2027.
- Thick bands: crews on the move. Trench, lay pipe, backfill and reinstate. Flatter band = faster crew. Thicker band = longer at each spot.
- Breaks: crossings. The road, railway and river viaduct are built first. The main crews skip them, so each band steps across.
- The viaduct, like a bridge. Abutments and a pier first, then the deck, then the pipe on top.
- Small shapes. Valve chambers V1 to V3, built in the gap (the buffer) between the trench and pipe crews, and marked on the map. Pressure tests. Handover.
- Hatched bands: restrictions. No road closures at Easter: the road crossing waits for it to end. No in-river work in June and July: the pier is finished in May.
- Red ring: a clash. The pipe crew runs into the open trench near 3.8 km in mid-July: same place, same time. The plan holds the pipe crew back about six working days, then it follows behind the trench.
NexPlan spots clashes for you
The ring is drawn by hand. The finding is automatic.
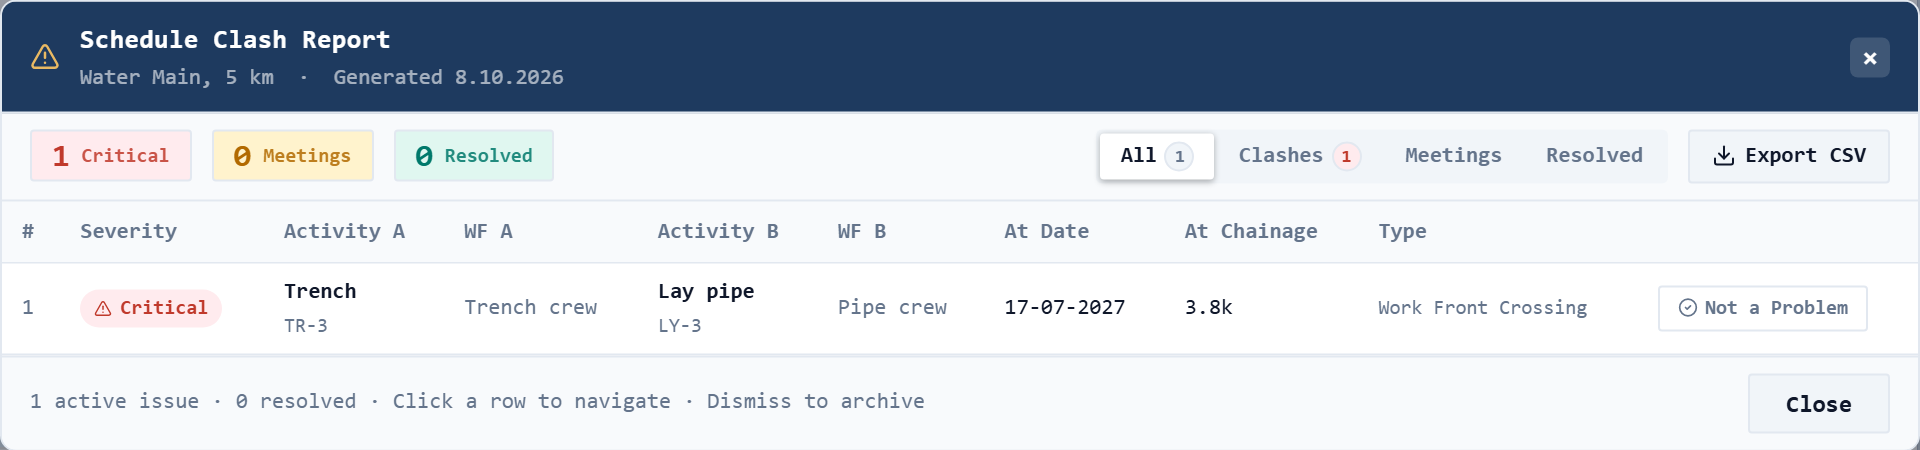
- Crews are tagged as work fronts (here: Trench crew, Pipe crew).
- The Clash report lists every place two of them cross. Here: 1 Critical, 17 July 2027, 3.8 km.
- Click a row to jump to it on the chart.
- Decided what to do? Mark it Not a Problem and it moves to Resolved. Export the list as a CSV.
What a Gantt chart can't show
- Where. A bar chart shows when work runs. This also shows where.
- Clashes. Crossing lines mean two crews on the same stretch at the same time. A Gantt chart makes them look fine.
- Speed. The slope is the speed. A slow gang or a stalled stretch stands out.
- One page. A long route stays on one page, not dozens of bars.
When to use it
When work moves along a route: earthworks, drainage, pavement, track, pipe laying, cable. Keep the Gantt for the logic and the critical path. Most programmes need both, drawn from the same activities.
In NexPlan Linear
Import a Primavera P6 XER and NexPlan Linear draws both charts from the same activities, with crews and what-if on top. It runs in the browser and is free today.
Try NexPlan Linear free · NexPlan Linear vs TILOS · Questions and answers