One programme. Time, location, crews and what-if.
NexPlan Linear is a browser-based linear scheduling tool: your P6 programme, drawn on the route as a time-location (time-distance) chart. Import a Primavera P6 XER and schedule with CPM. The same activities also open as a Gantt, or a crew / what-if scenario.
Try without an account · saved only in your browser. Sign in later to keep projects in the cloud.
Free · P6 XER in, XER out · Saved projects stored in the EU (Frankfurt)
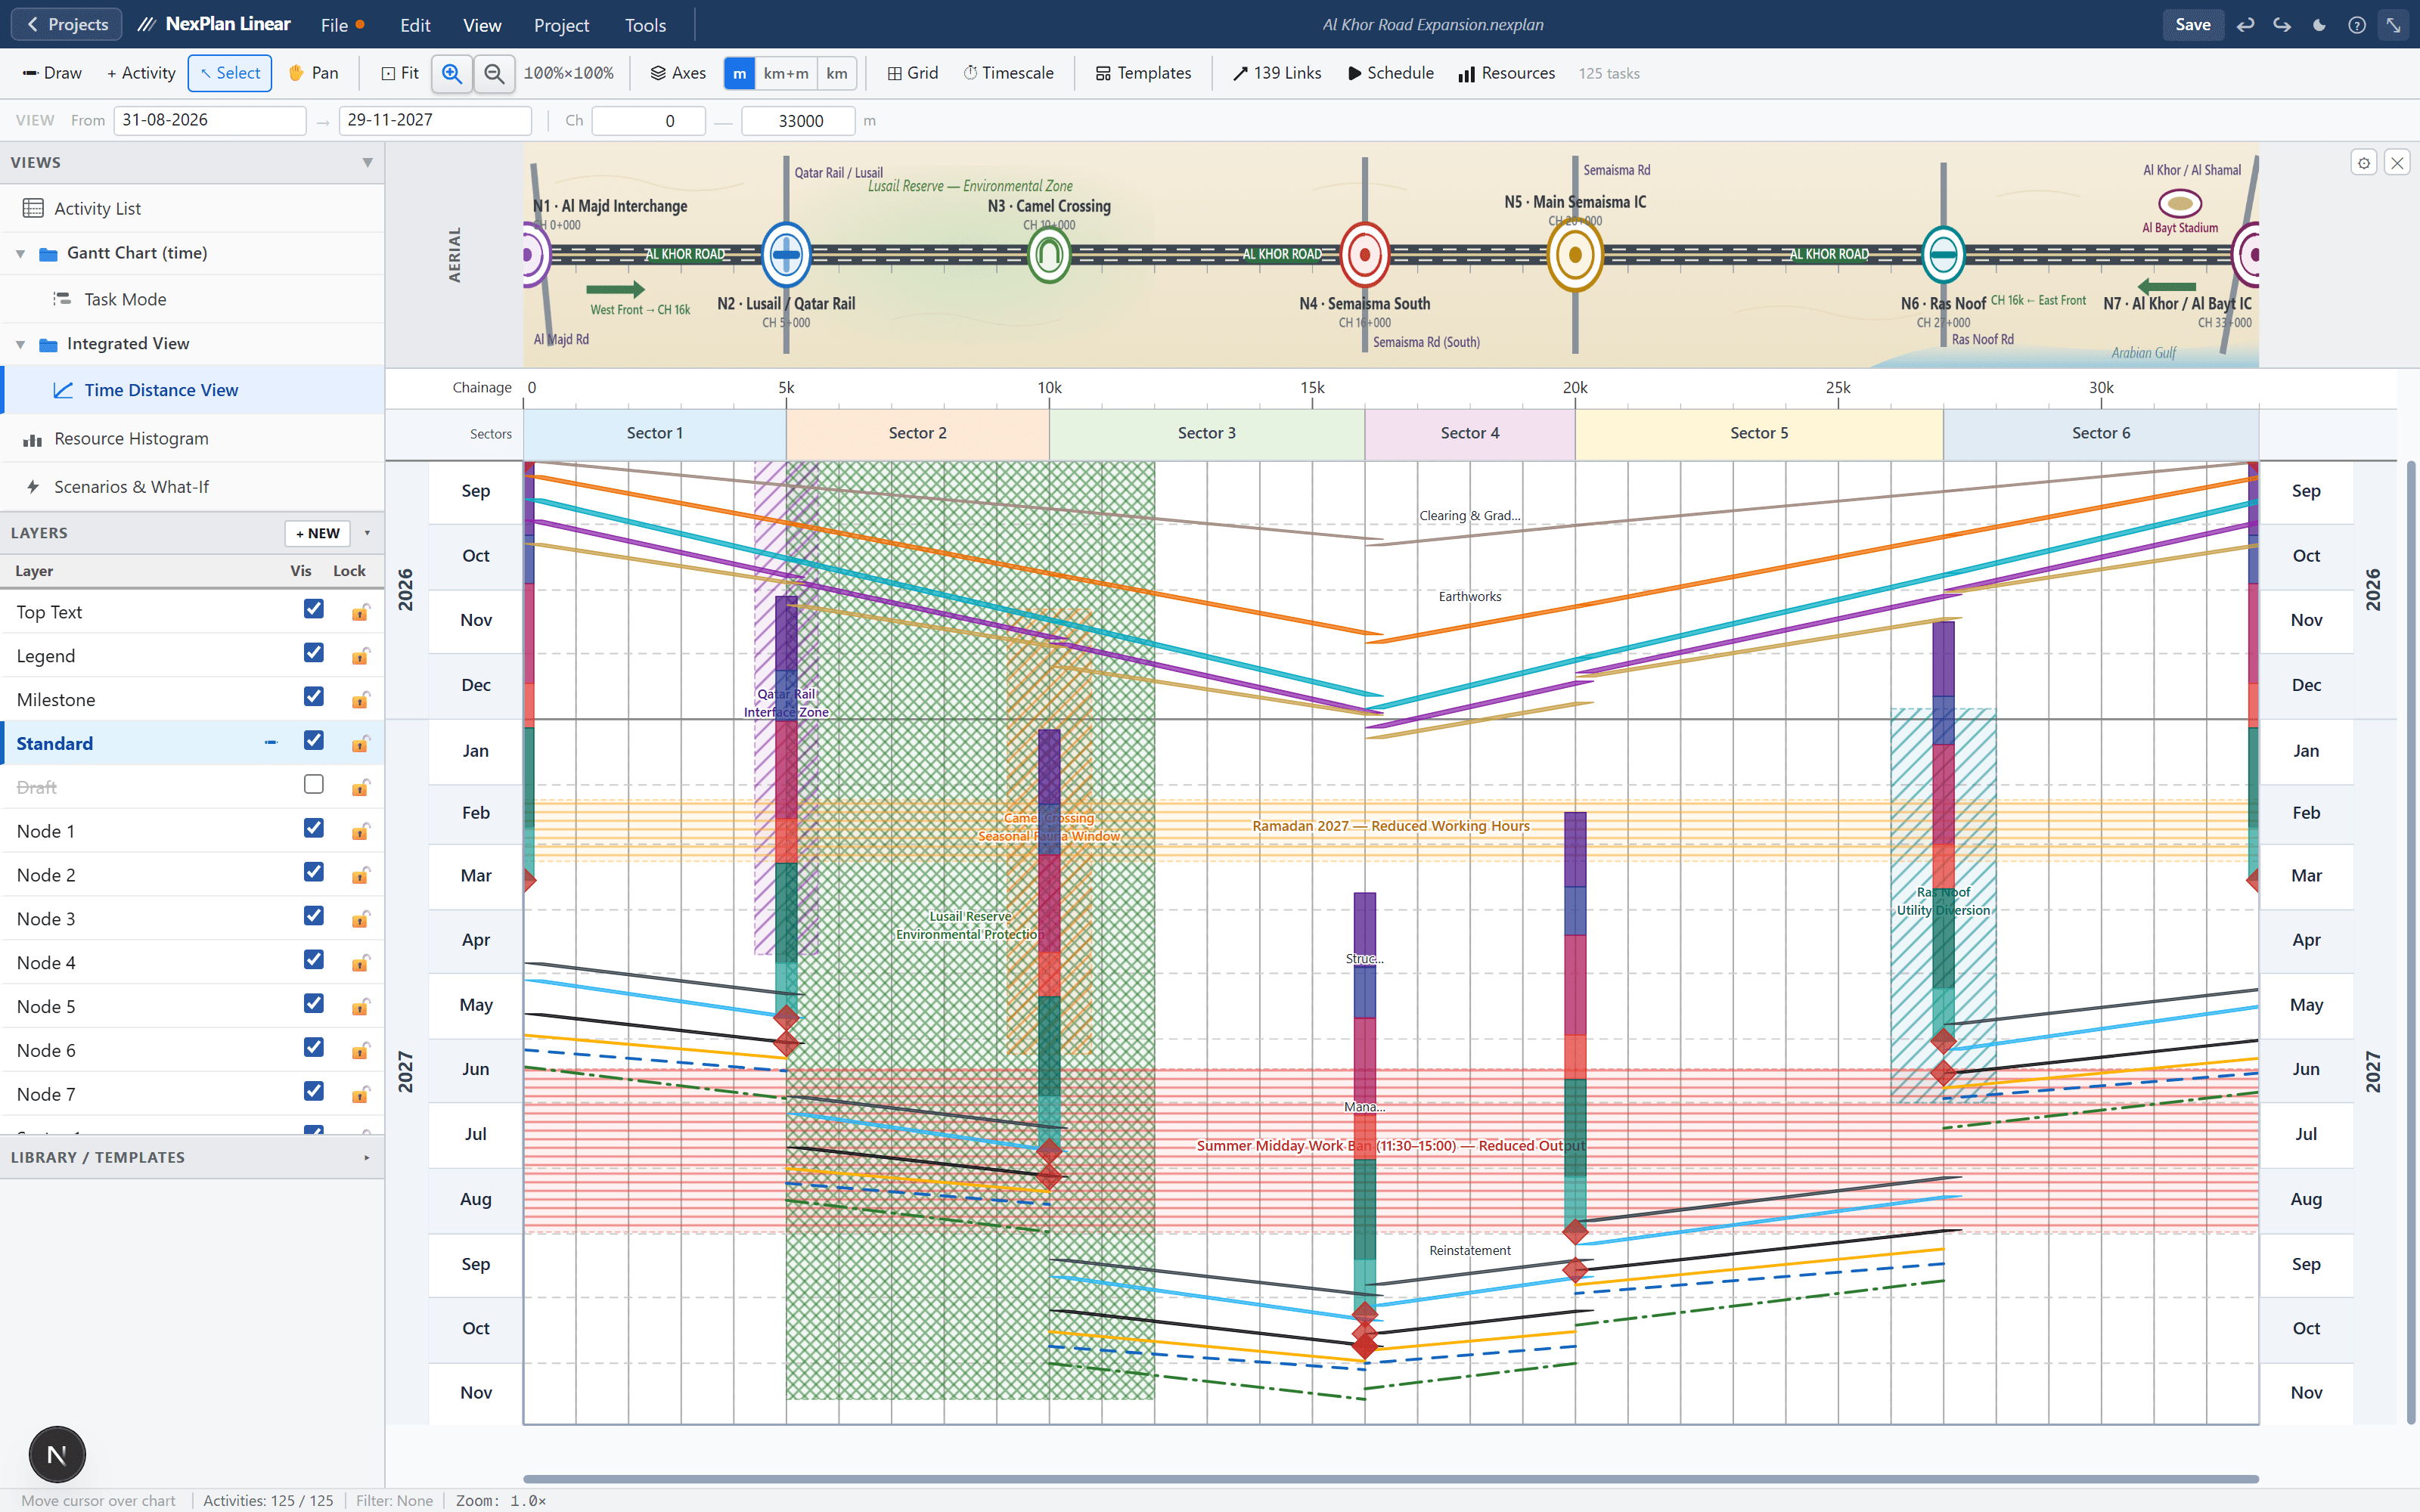
Highlight · time-location
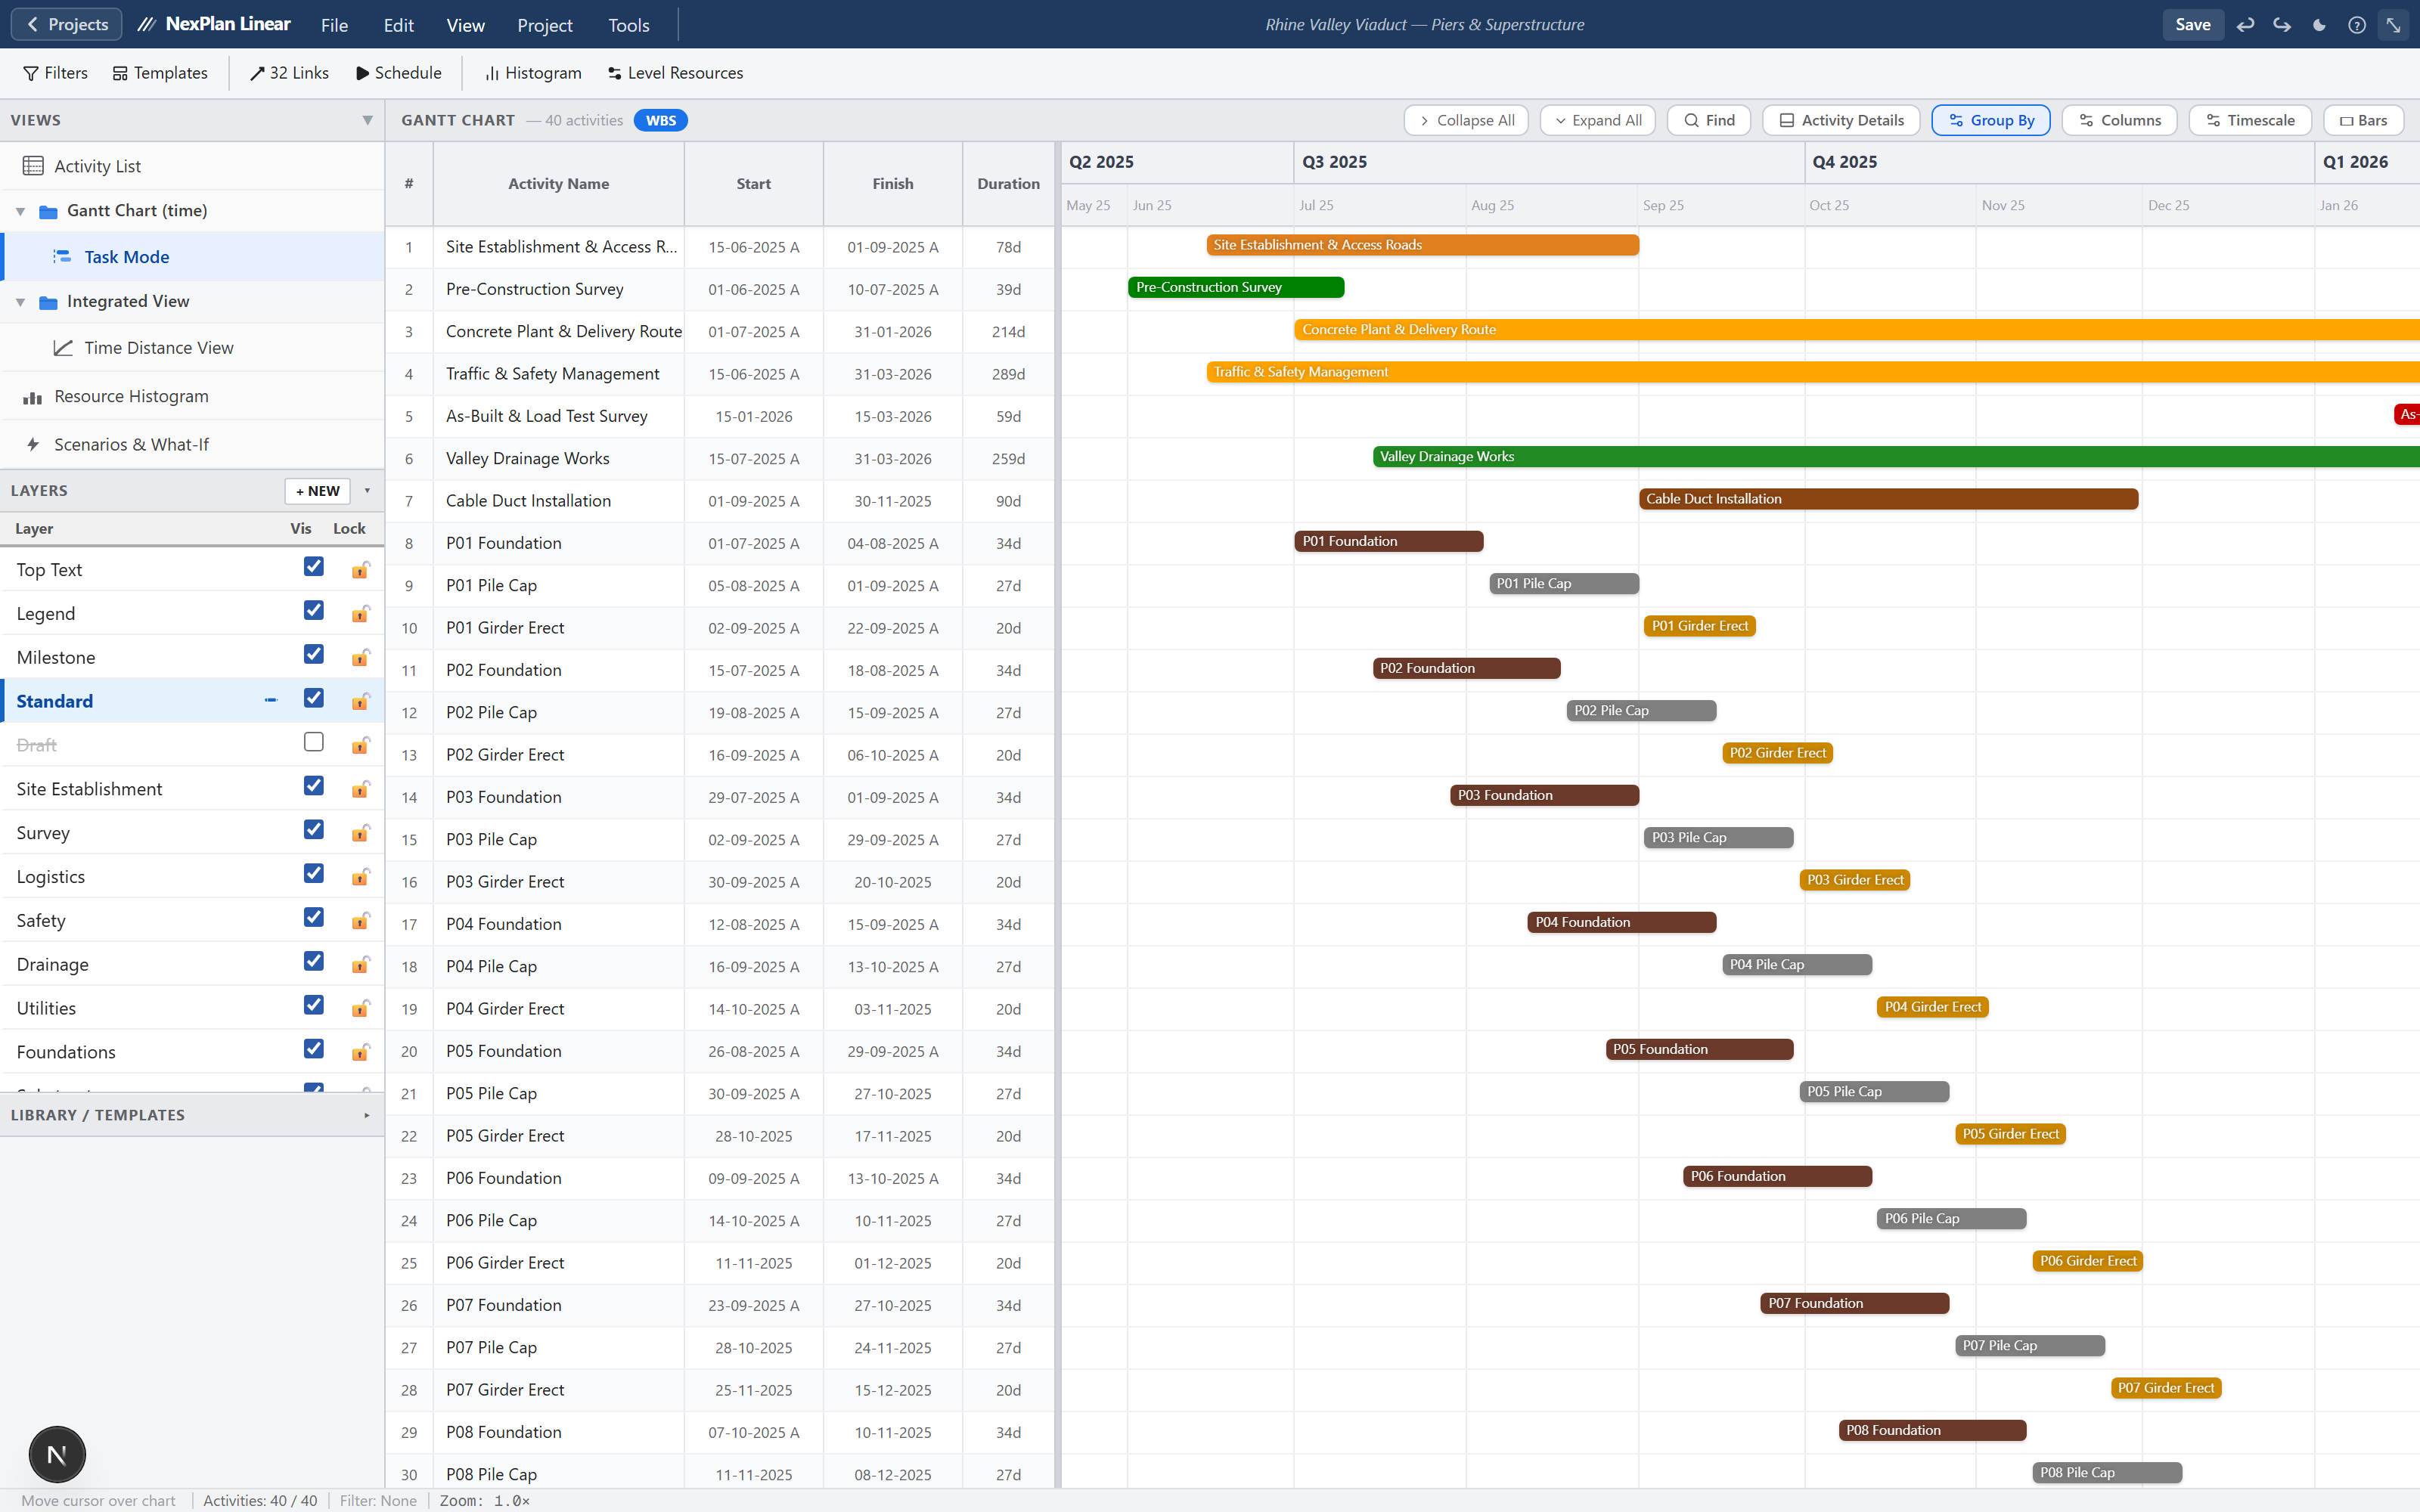
A Gantt chart tells you when.
Time-location also shows where.
Keep the Gantt for the network. When the work is linear (road, rail, pipeline, cable), plot it on time and chainage. Crossing lines are a real spatial clash, not two bars that happen to overlap.
“A delay in one location cascades down the alignment. You see it coming when time and space share the same chart, and you still have the Gantt for the rest.”
Built for infrastructure programmes
Strongest on linear work. The Gantt, crews and what-if views apply to the rest of the programme too.
Capabilities
Four readings of the same programme.
Schedule
Import a P6 XER. Run CPM with constraints, calendars and float. Work the programme as a Gantt and a WBS. The same data the other views read.
Time-location
The linear highlight: plot work against time and chainage. Crossing lines are spatial clashes, not just overlapping bars.
Crews & what-if
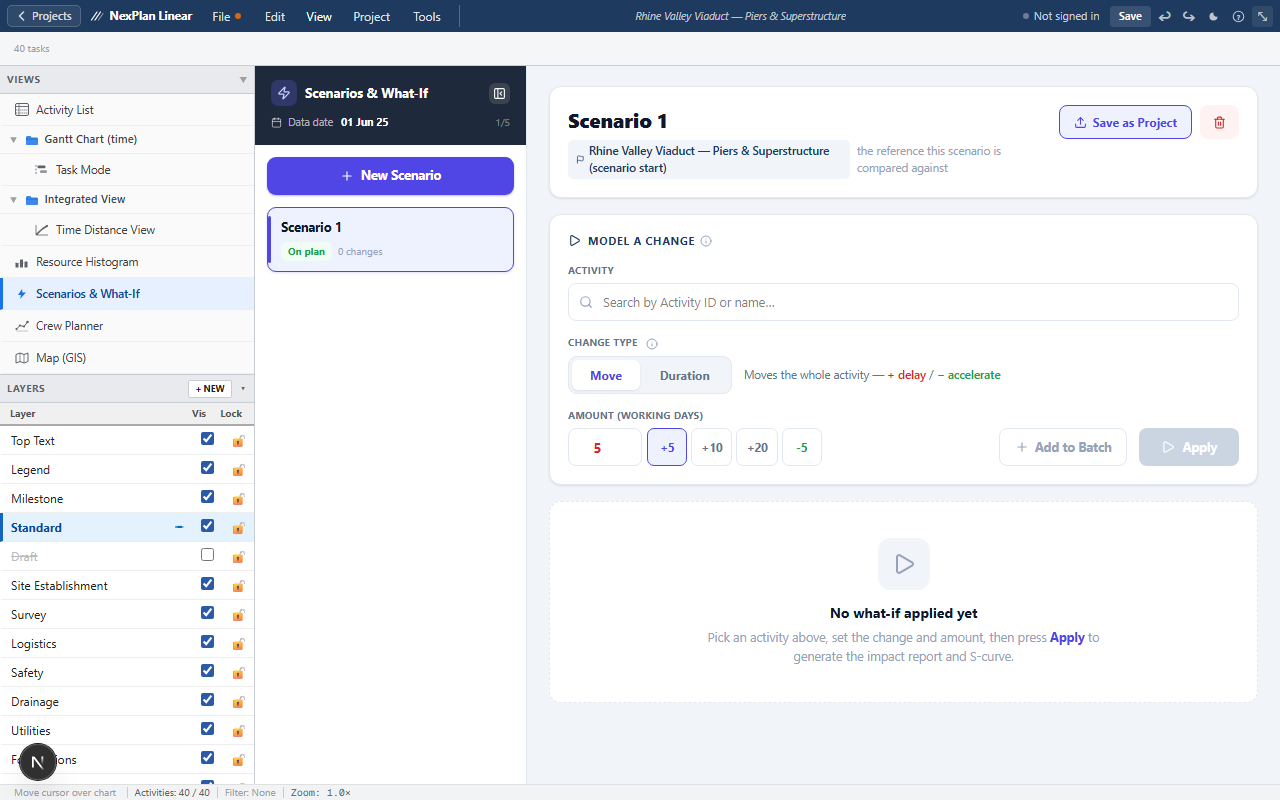
Ask what a second crew does to the finish. Freeze a snapshot, delay or accelerate activities, and compare against the baseline.
GIS (coming soon)
Coming soon: Drop a GeoJSON or Shapefile of the centreline, set chainage, and read the same activities on the map that sit on the chart.
Crews & what-if
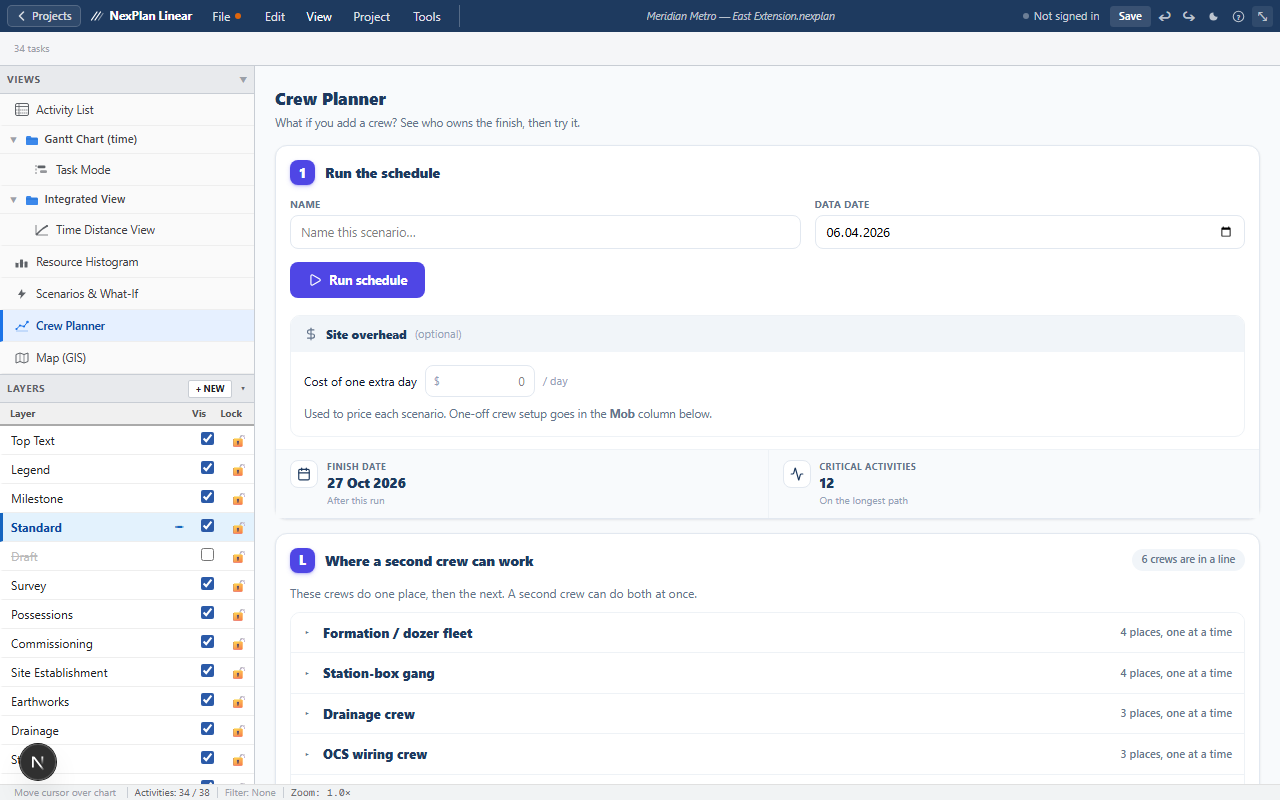
Add a crew. Delay a task. See who owns the finish.
Crew Planner and What-if share the same idea: freeze the current plan, try a change, read the impact against the baseline. One adds whole crews. The other moves or stretches individual activities.
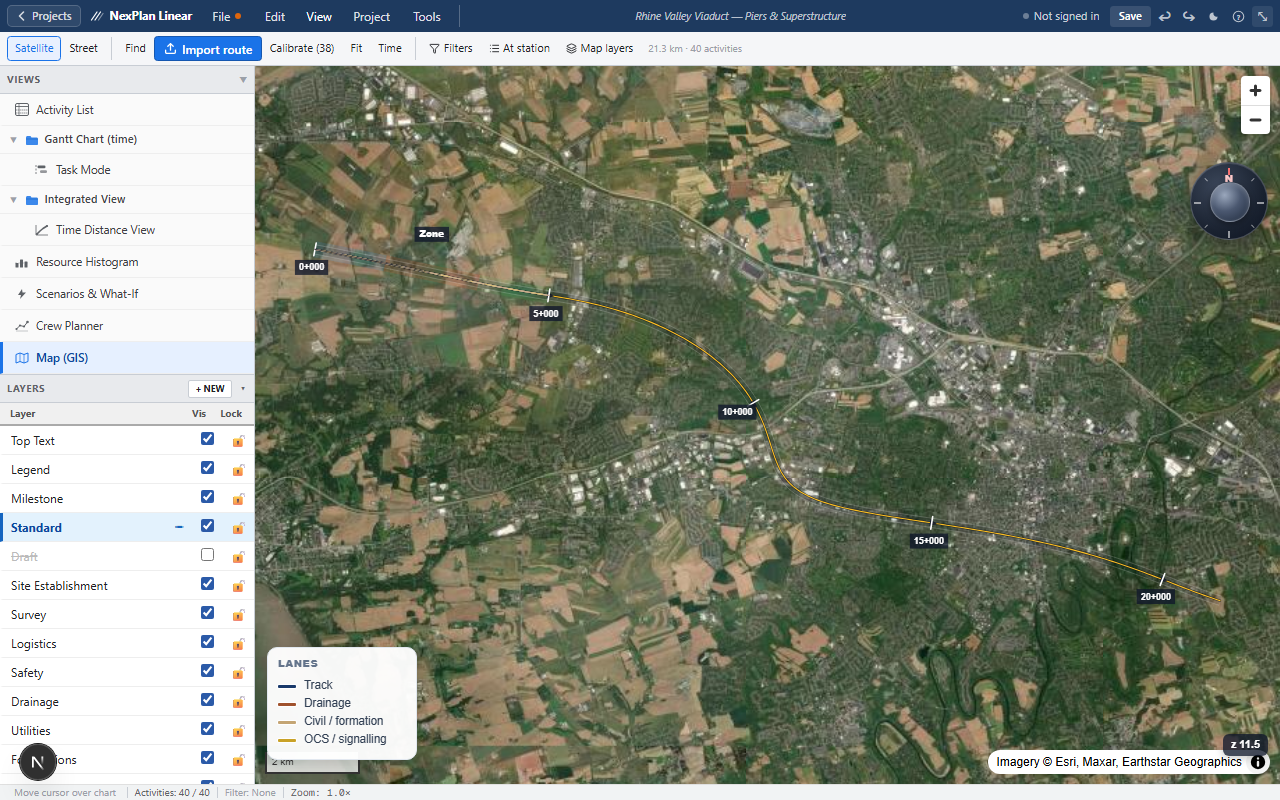
GISComing soon
The same activities, on the route.
Import a GeoJSON or Shapefile centreline, set chainage at two points, and the map and the time-location chart share one stationing. Filter at a station. Read work in place, not only in a table.
- Centreline from GeoJSON or zipped Shapefile
- Set chainage once. Chart and map stay in step
- At-station filter and corridor lanes by discipline
Resources
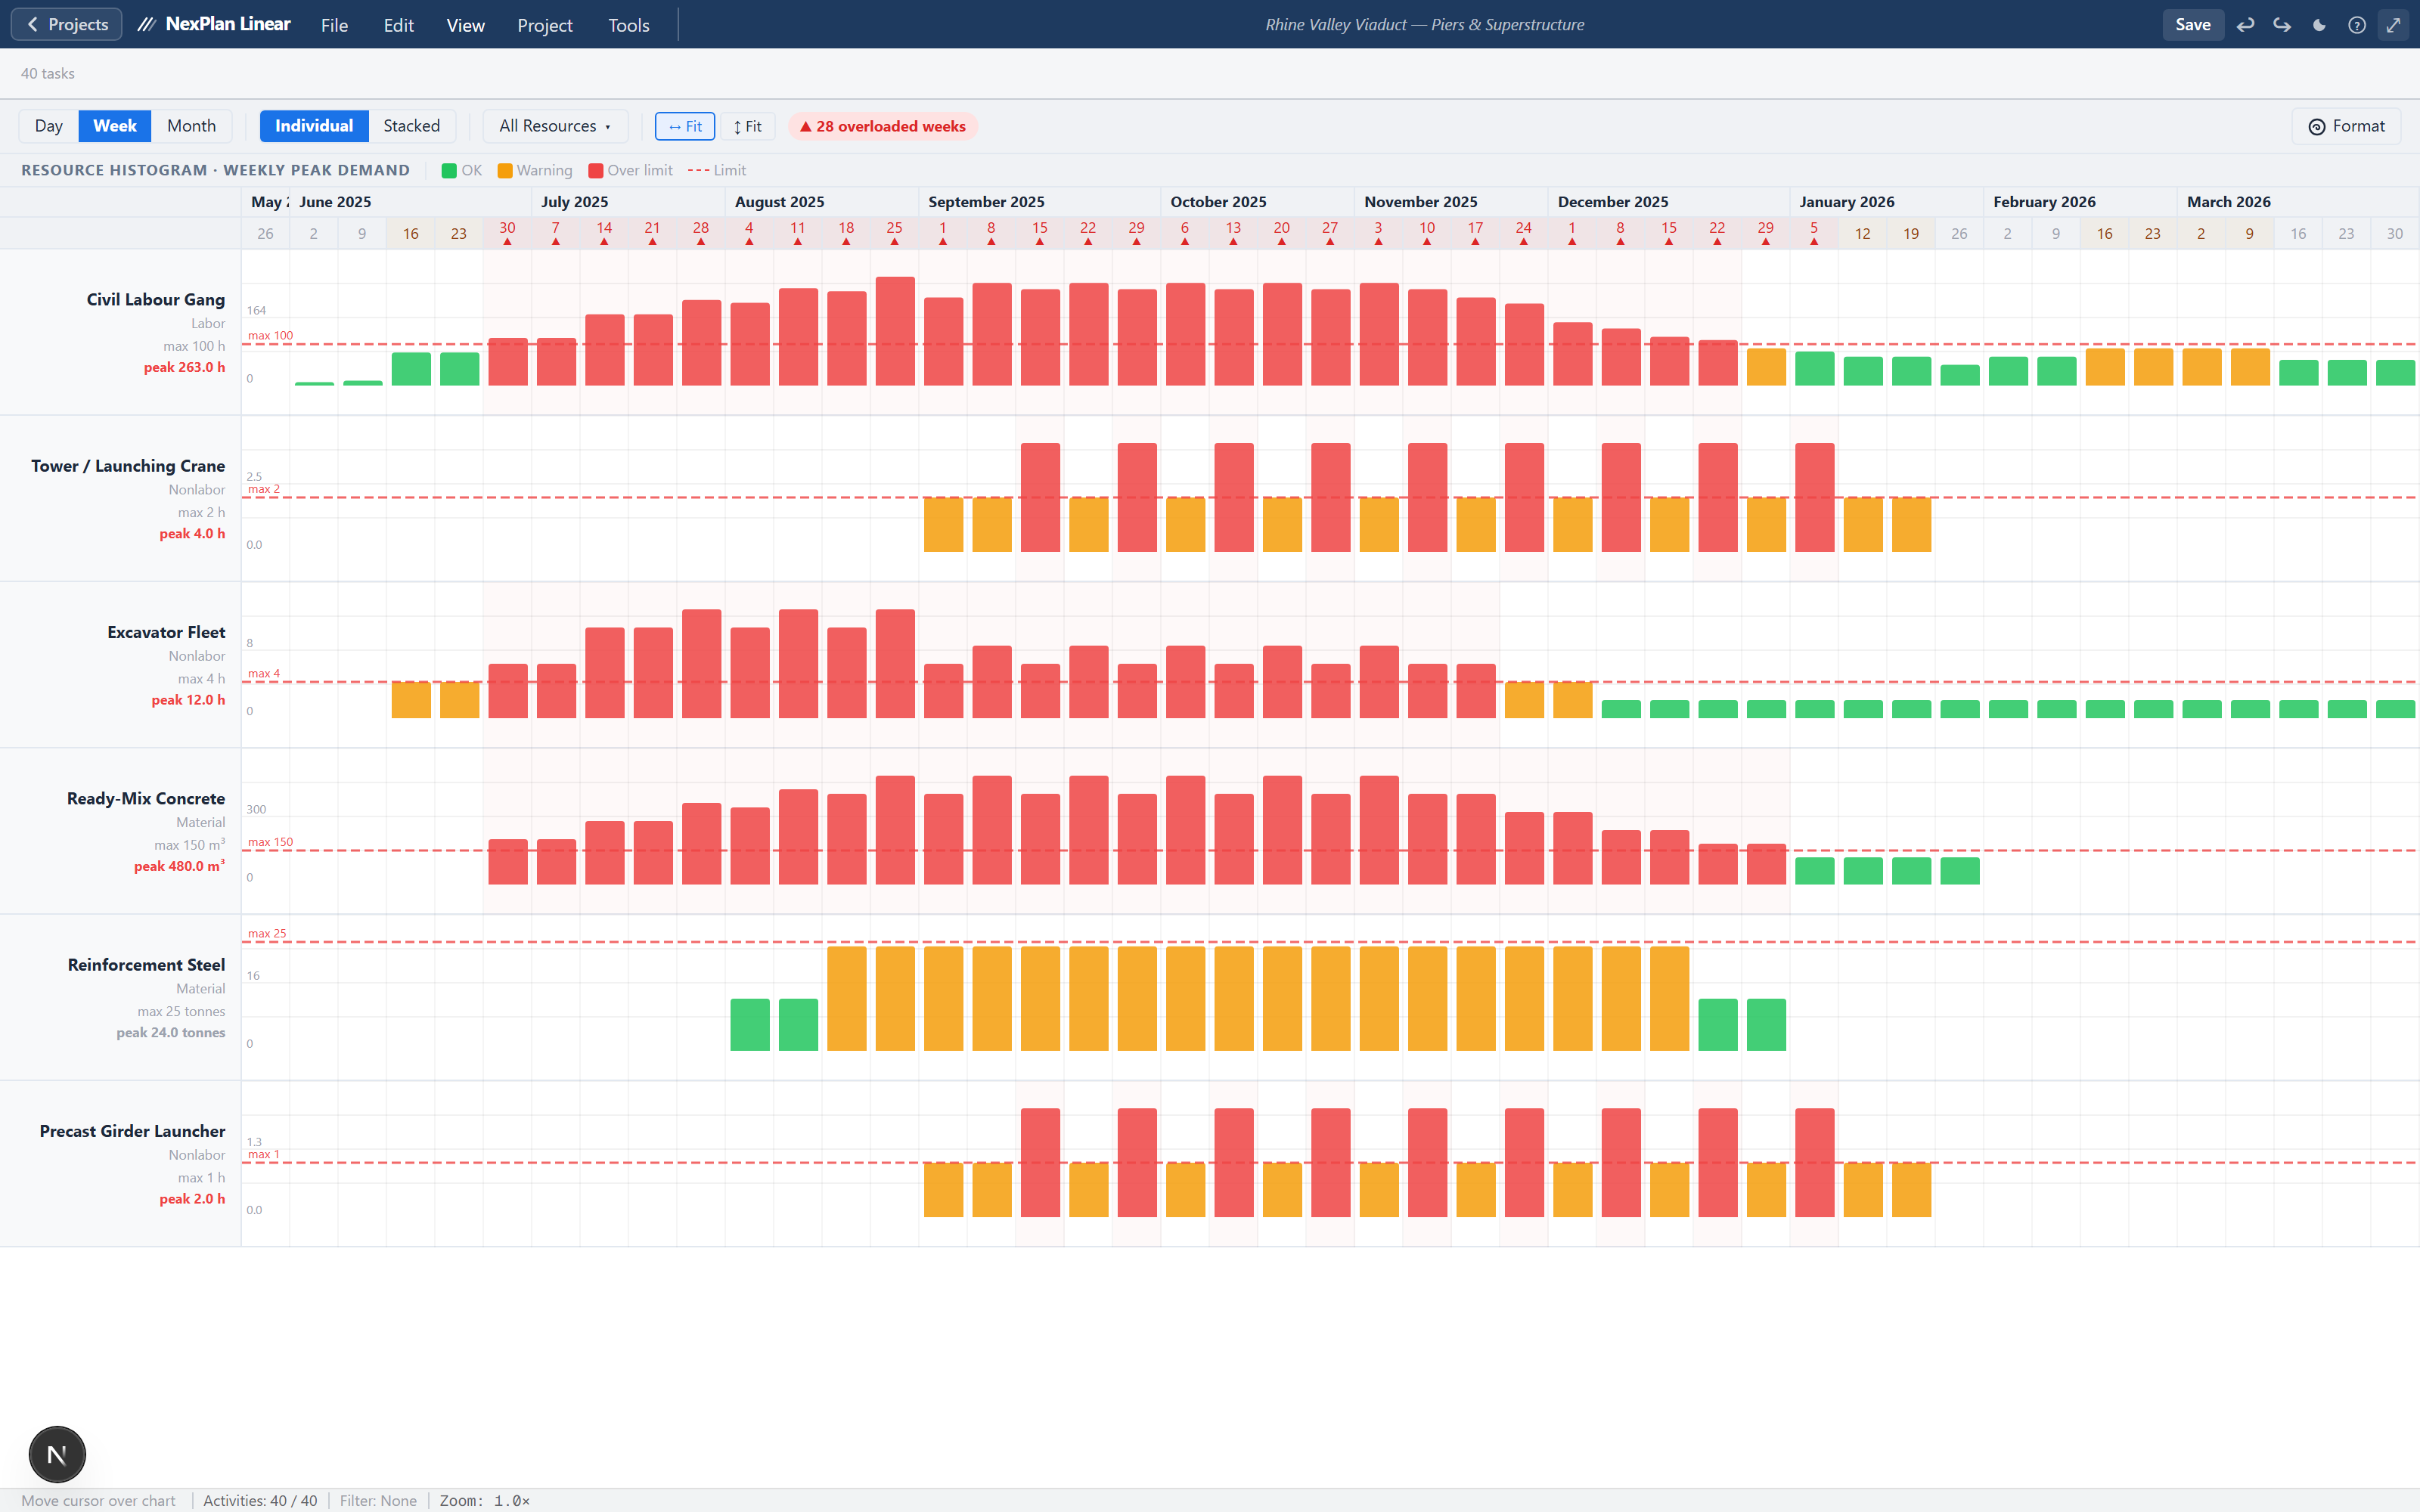
Spot every over-allocation at a glance.
A histogram plots peak demand for each crew, crane and material against its limit. The weeks that break capacity are flagged by day, week or month.
- Peak-demand histogram per resource
- Over-limit periods flagged automatically
- Drill from a red week to the driving activities
Leveling
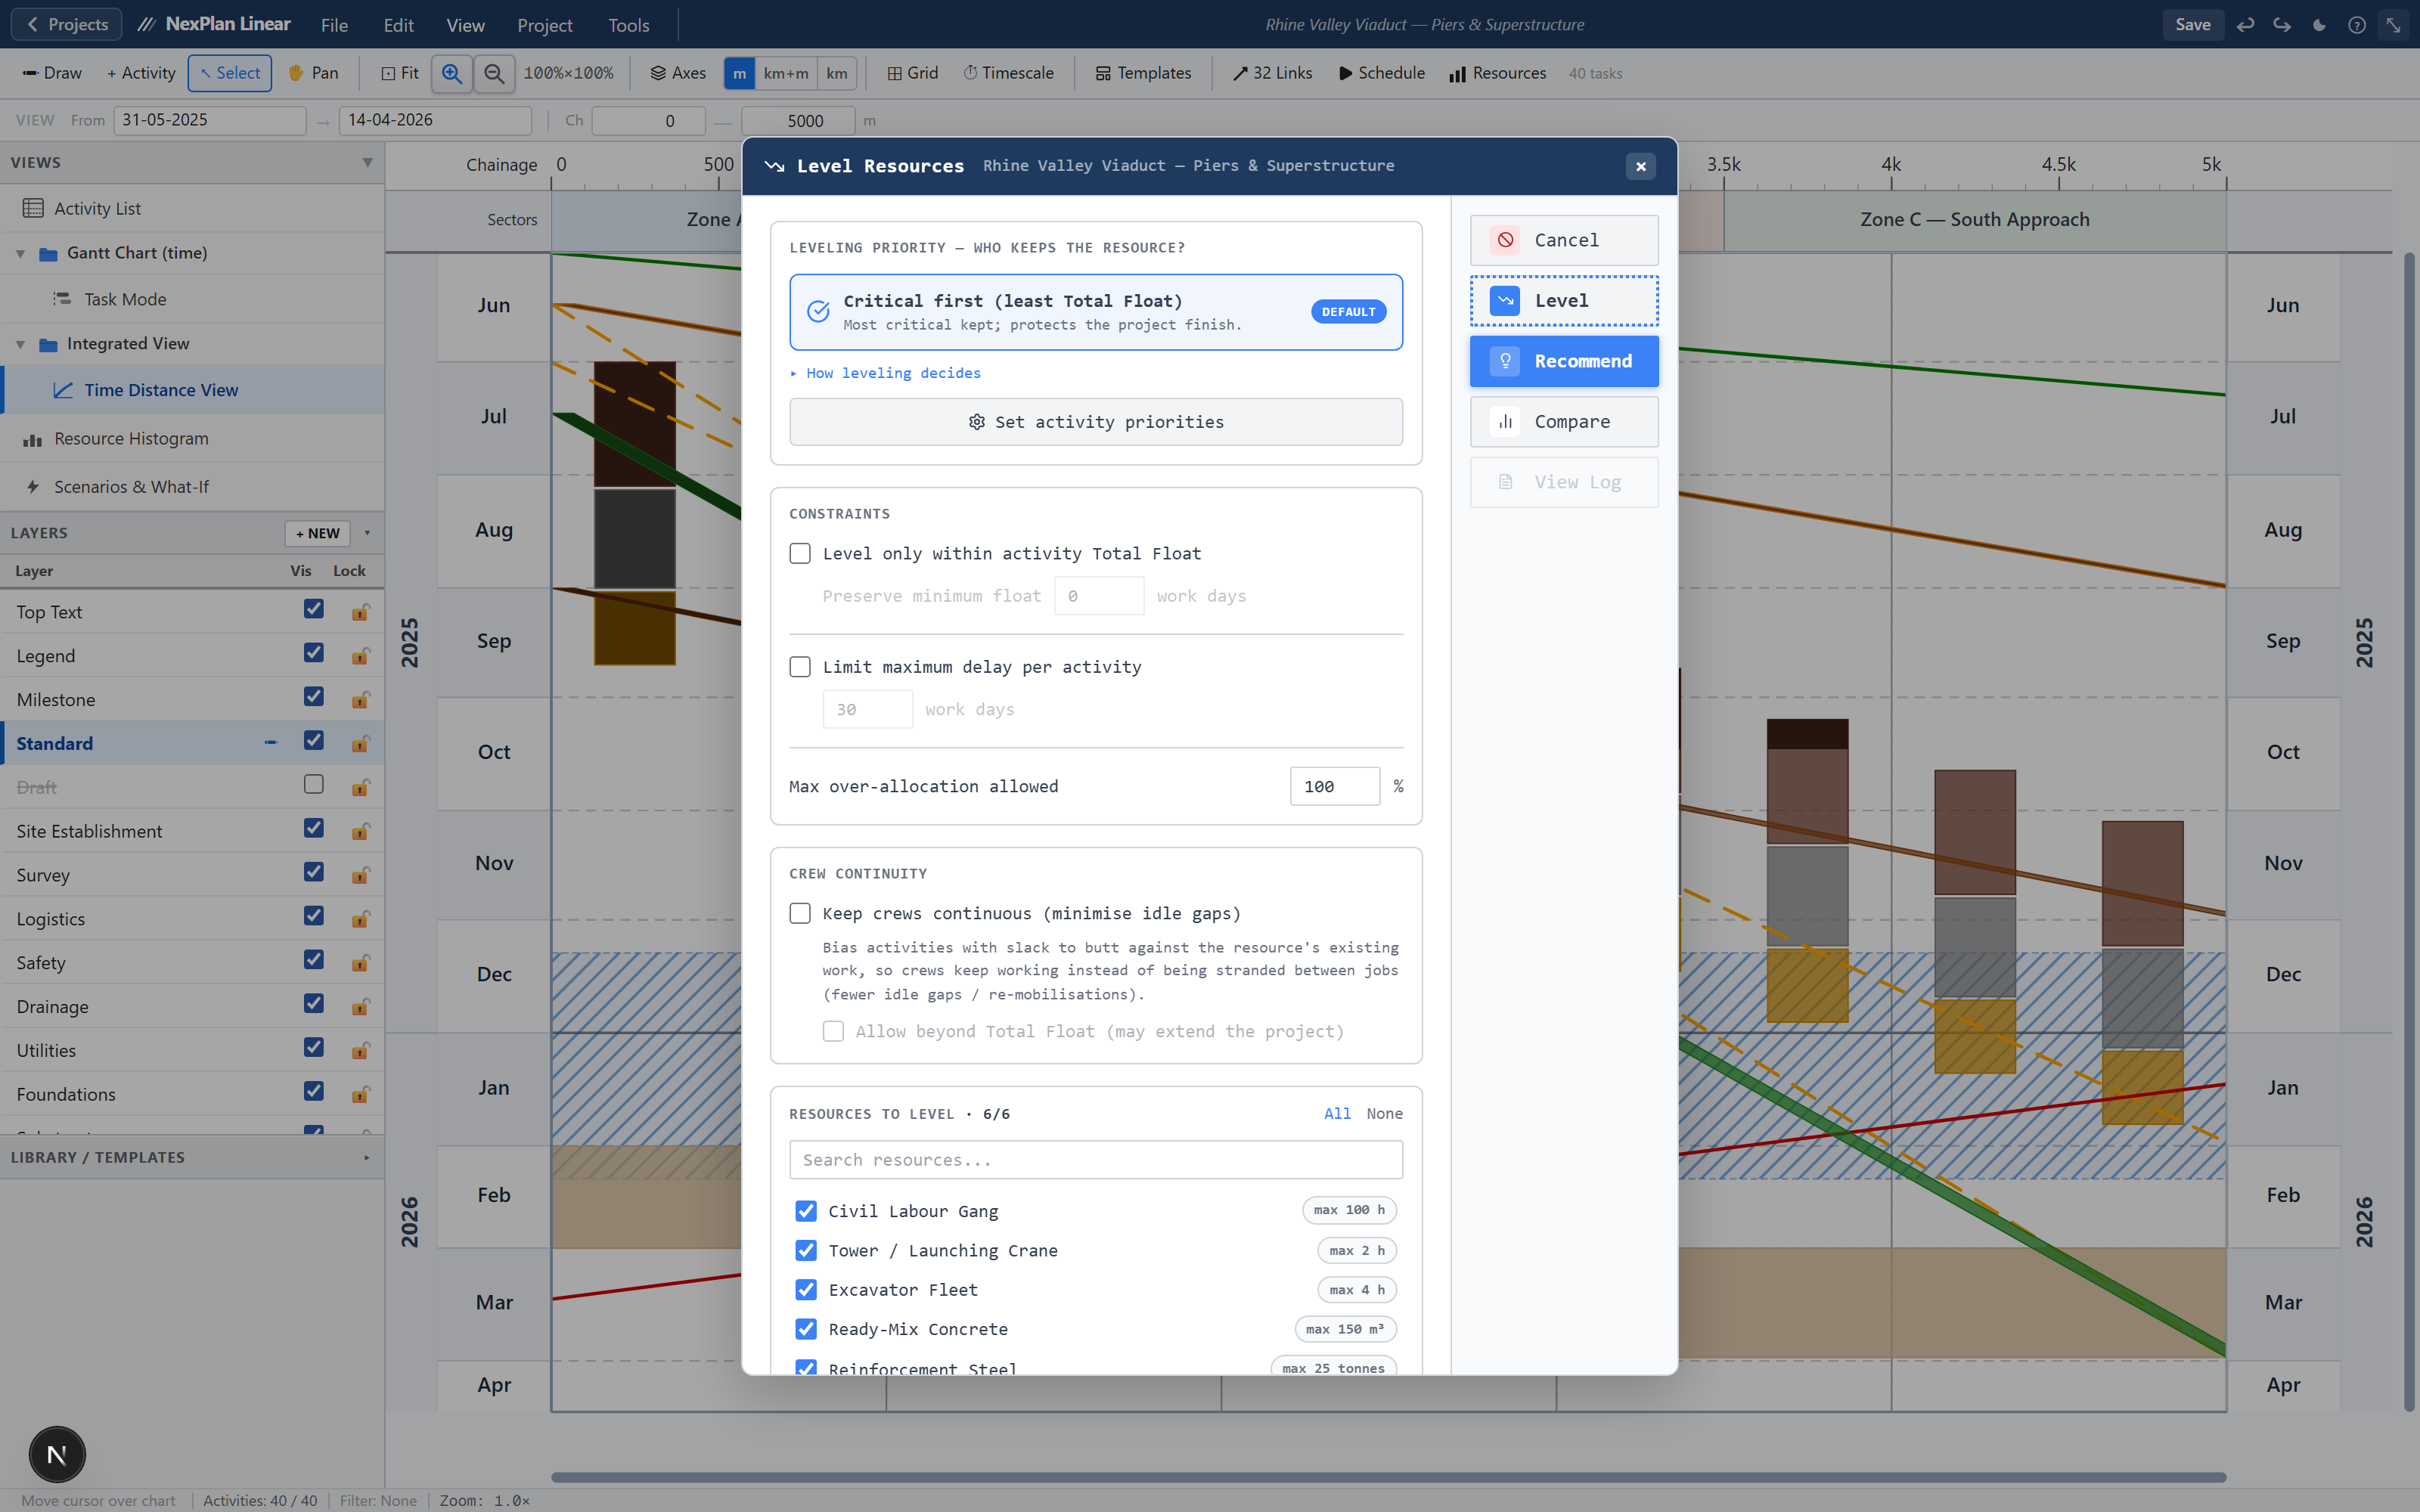
Level it, and keep full control.
Draft an automatic leveling pass and review every move before it touches the schedule. Cap delays within float. Data-date aware: it never re-levels the past.
- Priority rules: critical-first or your own order
- Constraints: within float, max delay, over-allocation %
- Review each move before it is applied
Checked against P6
The numbers are compared with Primavera P6, cell by cell.
The same programmes were run in P6 and in NexPlan and the results compared. Each round of checking is listed in the changelog.
Cells, first test
Baseline dates, durations and variances of a P6 project, compared with P6. 0 different.
Cells, second test
Random pairs of projects with all three Earned Value options. 0 different.
P6 rules, each tested
Dates, float, calendars, lags and level of effort: each P6 rule is numbered and tested against P6 results.
Where P6 itself is inconsistent (for example milestones in baseline columns, or activities added since the baseline), NexPlan gives the consistent answer and says so. Checking is not finished: more rounds against P6 are planned.
How it works
From a P6 file to Gantt, time-location and what-if. Three steps.
Import the programme
Drop a Primavera XER, an Excel sheet, or start a new project. WBS, calendars, resources and links come with it.
Plan in the view that fits
Gantt for the network. Time-location for the alignment. Same activities, different reading.
Test crews and what-if
Add a crew, move a task, see who owns the finish. Then export LPXF, PDF or take the scenario back into the plan.
Your data
Your programme stays yours.
Stored in the EU
As a guest, projects stay in your browser. Signed in, your saved projects sit in a private database in Frankfurt. Each account sees only its own.
Take it with you
Download any programme as an XER or a NexPlan file at any time.
Never sold or shared
Programmes and XER files are not sold. Analytics counts visits and never sees project names or contents.
Who builds it
Built by a working infrastructure planner.
NexPlan Linear is built by Nageb Moustafa. The aim is simple: take the P6 programme you already have and see it on the route, without re-keying it. It is an independent project, and the changelog shows what ships.
Nageb Moustafa on LinkedInTry it with your own schedule
Try it as a guest, or create a free account to keep your projects in the cloud. Import a P6 XER, or open the built-in demo first. Gantt, time-location and crews are in the same project.